
Snapp is the largest ride-hailing app in the Middle East, with over 60 million users and 1M rides per day. We decided to improve the application’s experience for users with disabilities. This is the first time in Snapp that we want to improve our design for these type of users.
More than 1.4 millions of people in Iran have some sort of disabilities which is causing them problems in using Snapp. Physically disabled, deaf, and blind are the main 3 disability types in Iran.

Based on product metrics in Google analytic and AppMetrica, we gather some quantitative data like :

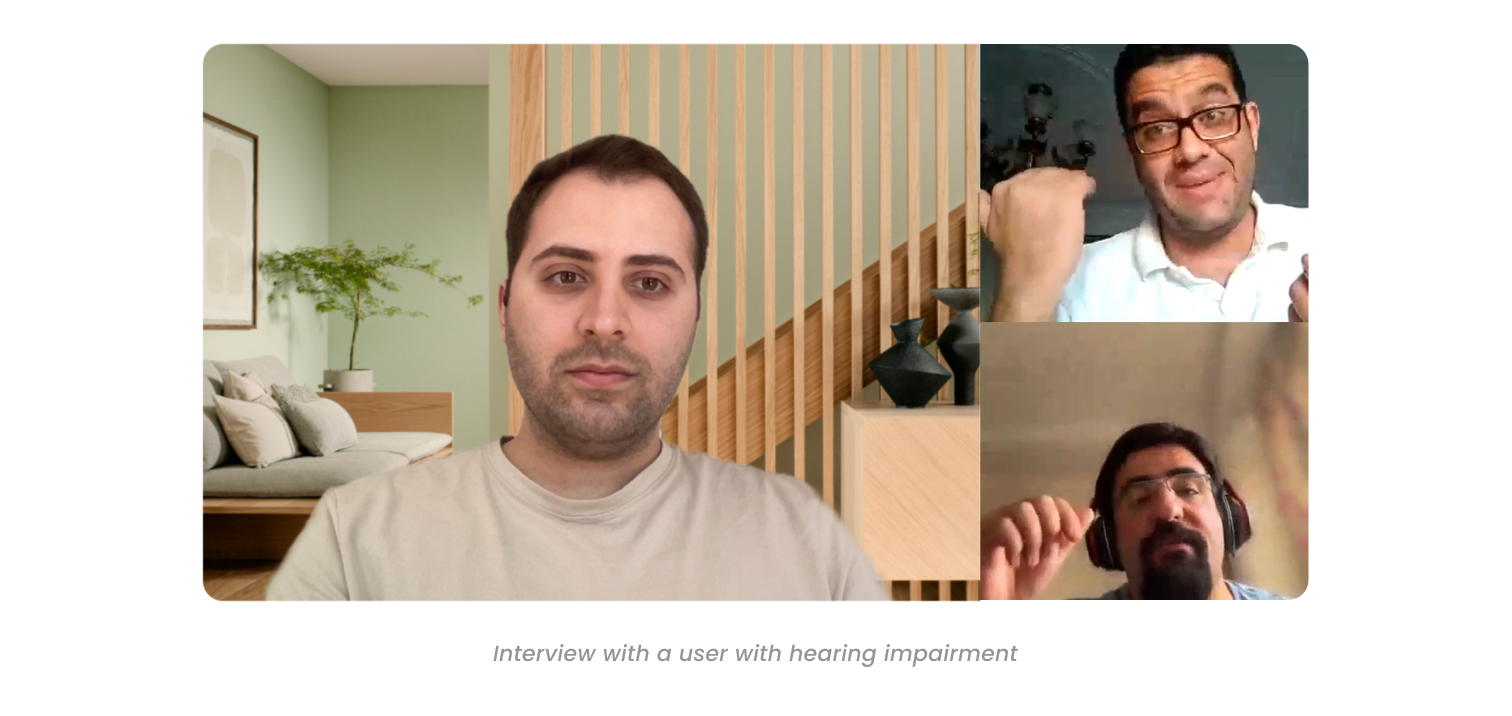
For more discovery and empathy with these group of users we decided to conduct a user research to understand their pain points while they’re using our app and gather qualitative data in 1 on 1 interview as well. Here are some of the findings from user research :
Based on the findings from user interviews, the following design solutions were implemented :
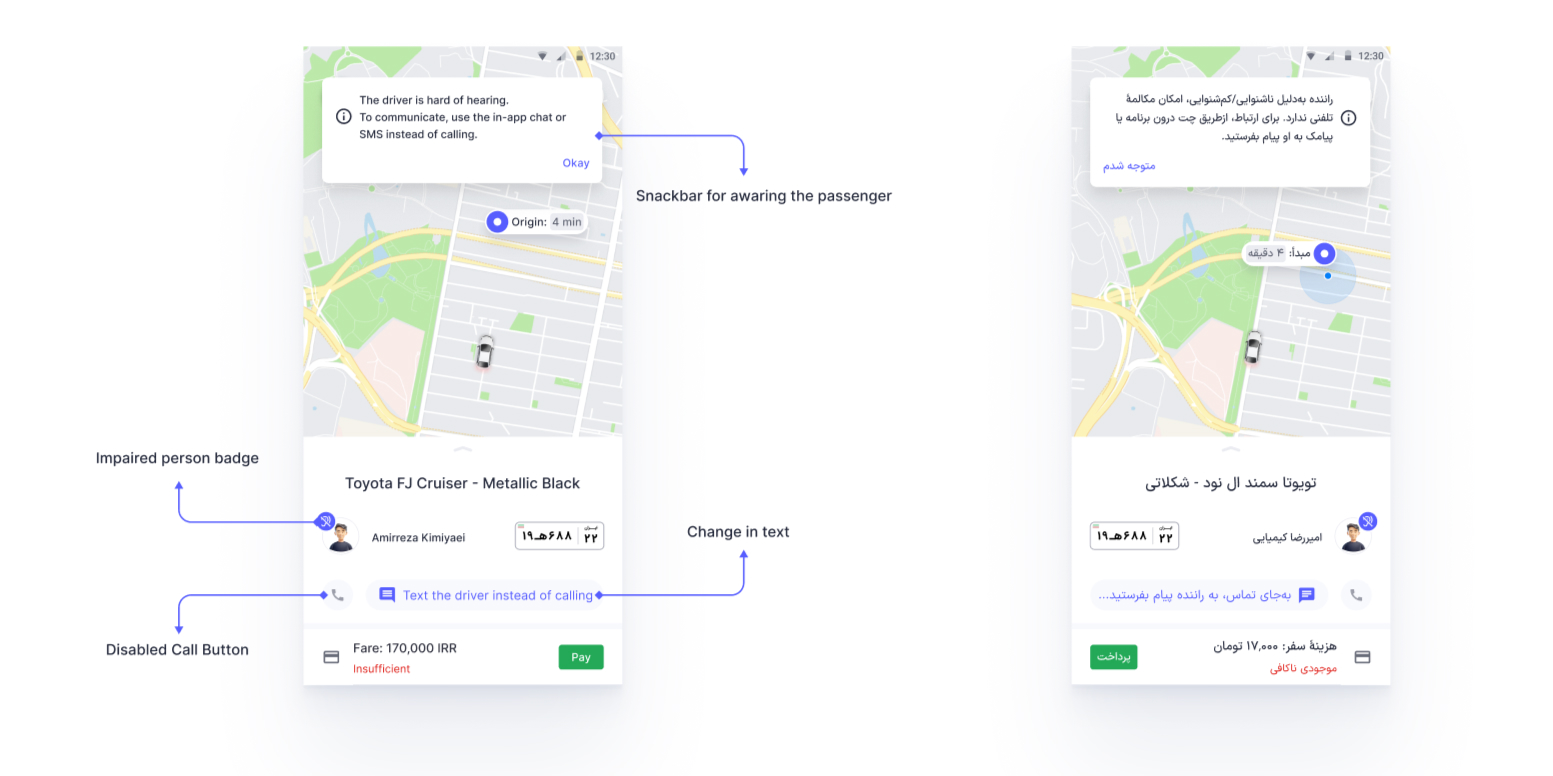
Based on the research findings we should inform users about driver disability. If the driver has hearing impairment, users can’t call them so they have to communicate with the driver in other ways like chat or SMS. For the first iteration I did these design changes on driver assigned card :
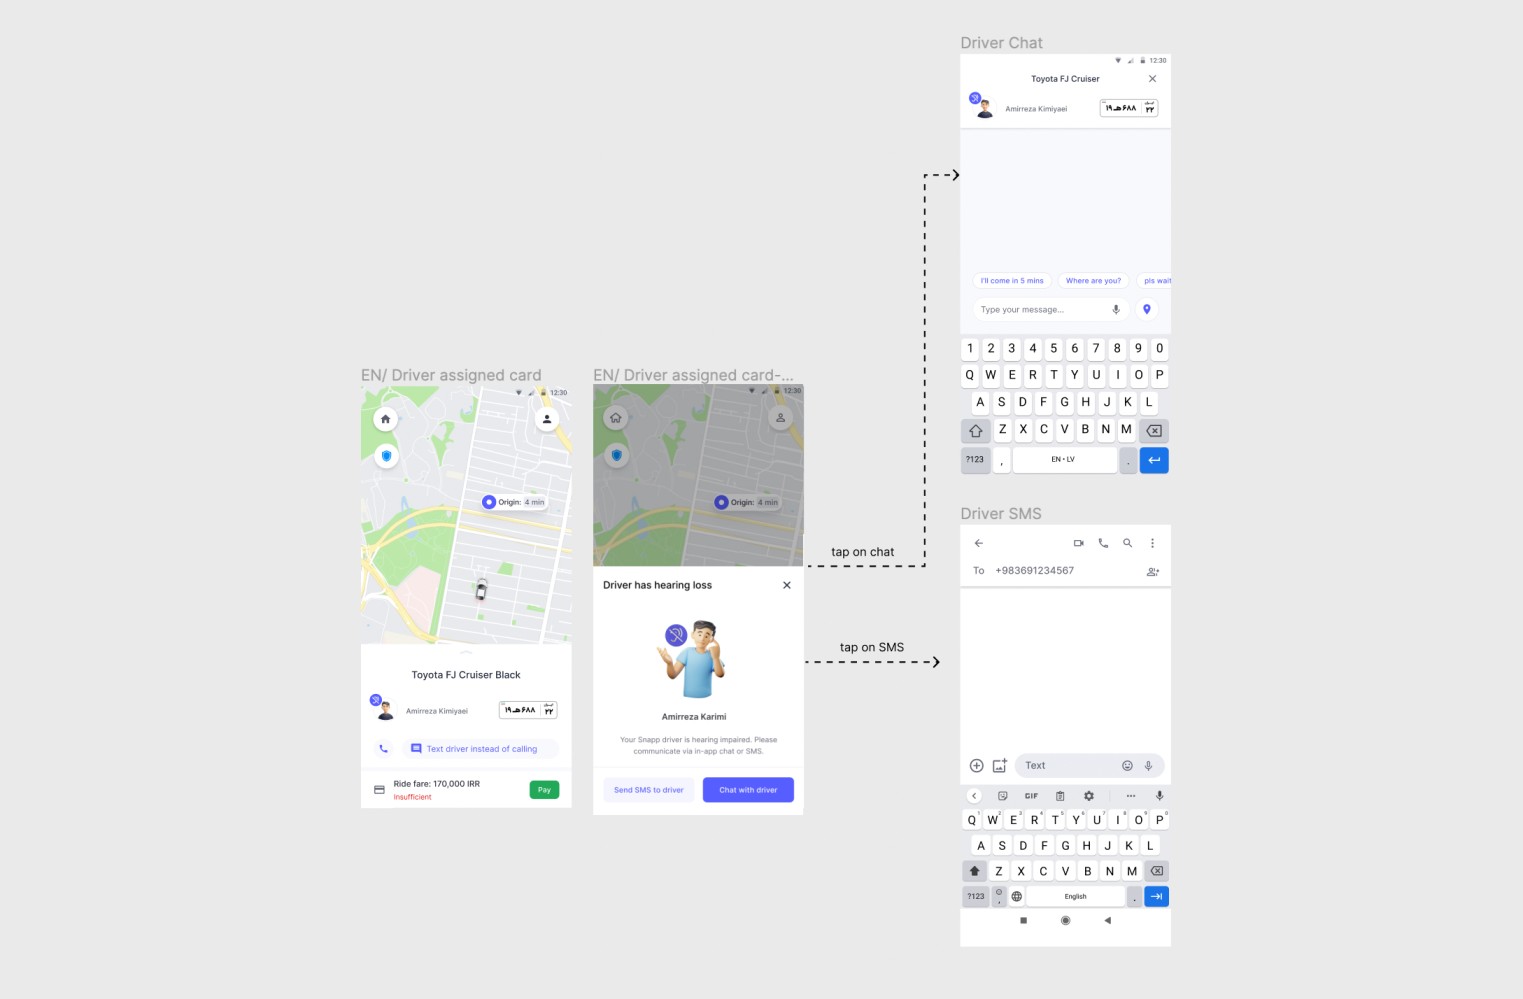
I reviewed the first iteration within my team in a design meetings and got some feedback related to the snack bar for informing the users might not get users attention well enough and they might not even read it fully and hit the okay button, so we needed a more eye catching solution. I design a bottom sheet modal to inform users better about drivers hearing impairment and they can chat or send SMS to the driver.
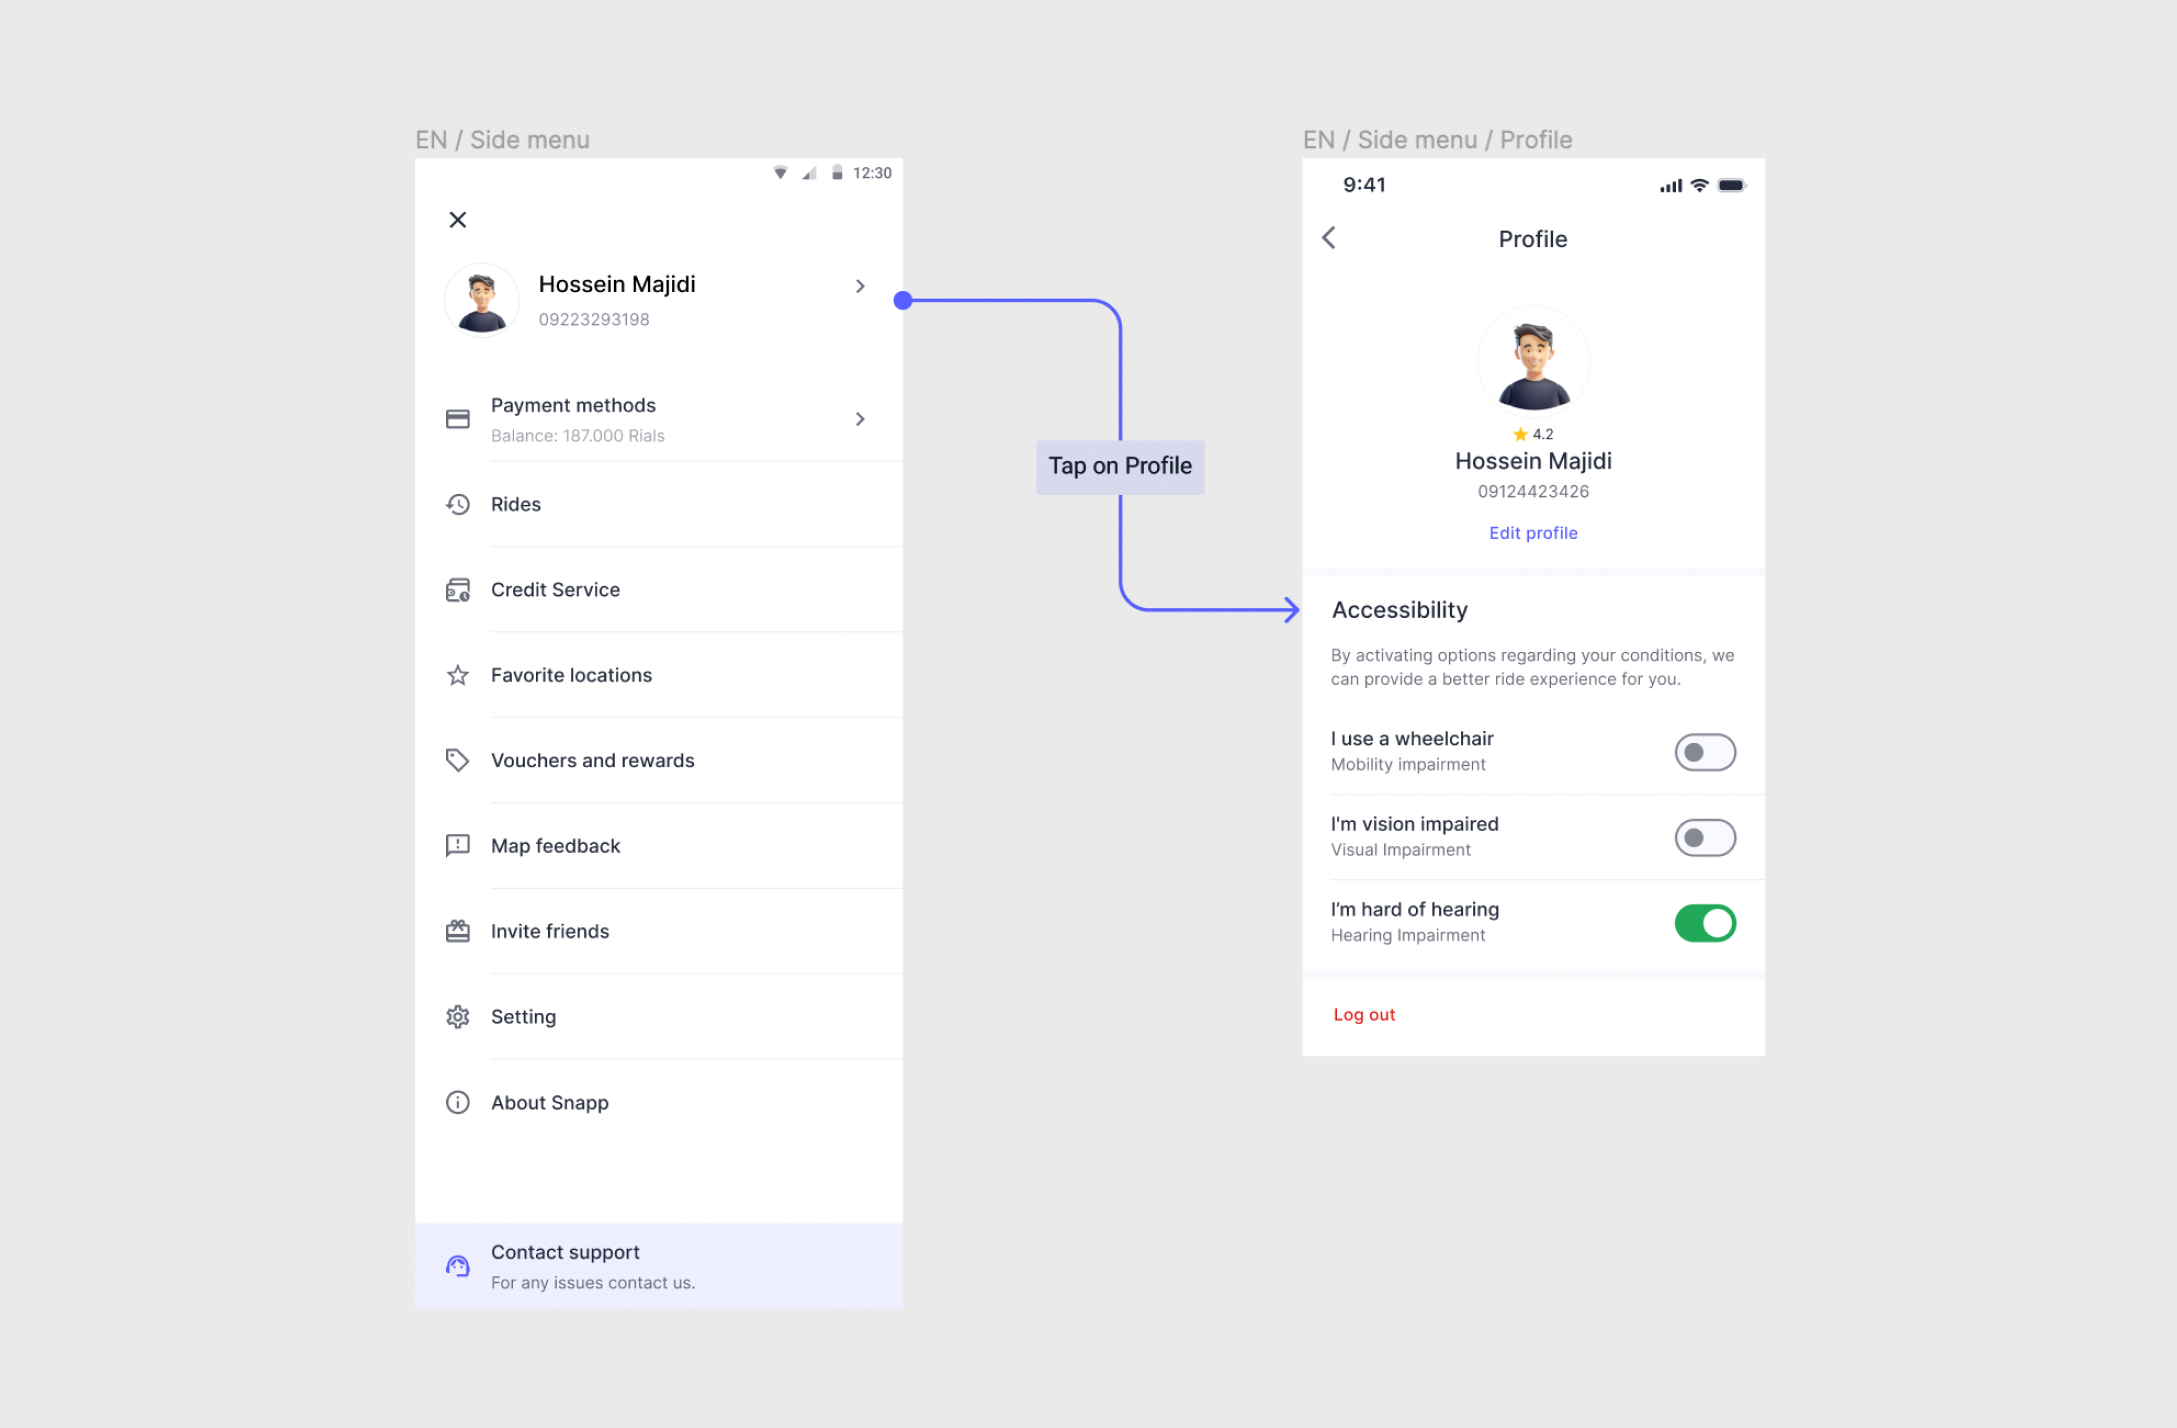
Due to the interviews that has been done for this project we have found out that most of the passengers prefer that the driver knows about their disability when they want to accept their ride to reduce their ride cancelation.
In the user profile page, I added a cell for disability. Passengers can turn on their specific disability switch and we inform drivers in a ride offering list when they want to accept or decline the ride.
We had to make sure our design improvement meet the user’s needs and fix the users pain points. So we constantly monitor the AppMetrica data on android app and watching the metrics and events for the next month after roll out. Fortunately, we found that the design improvements had a good impact on cancellation rate.
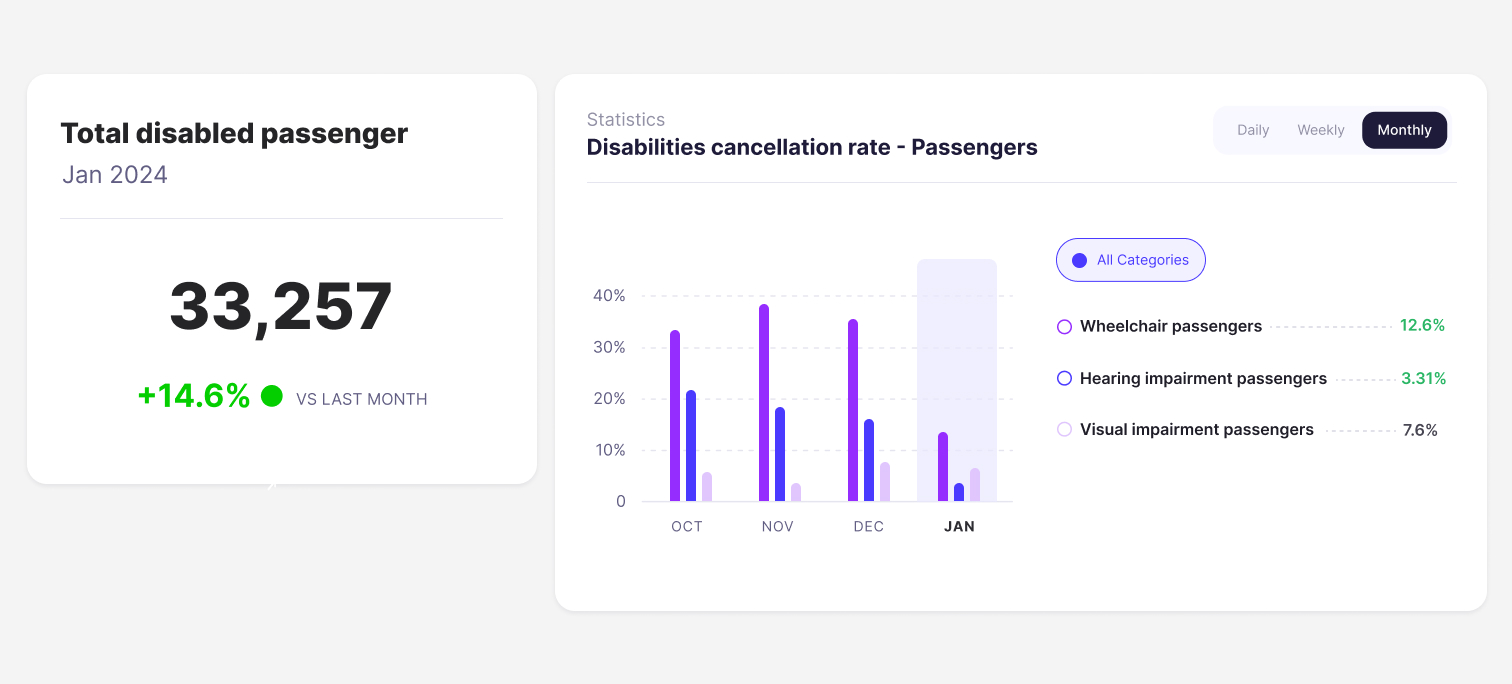
Design process is not a linear process! we should follow up the task from product department after design delivery and design Q&A and set events with help of PM to measure our design success or failure.
Getting feedback from a teammate is always helpful and all the teams benefit from their results


